Some things that have jumped out at me, after looking over recent elections and some historical data.
Minority Rules
How often does a majority government in Canada have over 50% of the popular vote? Not that often. In the two charts below, the bottom bars indicate a party's popular vote. The darker, top bars show the overrepresentation that pushed most of them into majority territory.
(M) Majority (m) Minority (mM) Minority Majority
Current Provincial Governments
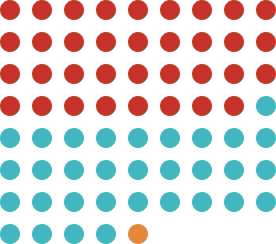
Nine provinces currently have a majority government, but seven of them received less than half the popular vote.
- CAQ
- UC / PC
- Liberal
- NDP
- Saskatchewan Party
Federal (Minority) Majorities
Only one of the last ten majorities had over 50% of voters' support. And just barely. And it was 40 years ago.
- Conservative / PC
- Liberal
Regional Sweeps
The fewer seats a province has, the easier it becomes for a party to take them all. True, there's only so many ways to divide up a limited number of seats, but why should less than 60% or 50% support result in 100% control? Two examples below, from the 2021 federal election.
Saskatchewan
Popular Vote

59%
8 seats
Representation

100%
14 seats
The Conservative Party had a clear majority of support, but 41% of votes received no representation.
Prince Edward Island
Popular Vote

46.3%
2 seats
Representation

100%
4 seats
With less than half the support of voters, the Liberals won all seats.
(Im)Balance of Power
In a first-past-the-post system, the ratio of popular support between parties can become severely distorted in the final representation.
Federal Election 2021
QC Popular Vote

3X
the votes
Within Quebec, the Liberals (3.4X) and Bloc (3.2X) each had over three times the support of the NDP.
QC Representation

30X
the seats
That support was magnified ten fold in the results, as the Liberals received 35 seats and the Bloc 32, compared to the NDP's one seat.
Ontario Election 2022
Popular Vote

Identical
support
The Liberals (23.9%) and NDP (23.7%) received virtually identical support.
Representation

Very Different
representation
The NDP got almost 4X as many seats (31) as the Liberals (8).
Party Pains & Gains
Federal Elections 2000-2021
A chart for each party, showing their over/under representation relative to their support in the popular vote (charts limited to parties/years in which a party received at least 5% of the popular vote).
For example, in 2021, the Liberals got 160 seats, which is 50 more than the roughly 110 seats their popular vote would have given them (50/110 = 45.5% gain). In the same election, the NDP got 25 seats, 35 less than the 60 their share of the popular vote represents (35/60 = 58.3% loss).
Conservatives
| Year | Seats | ||
|---|---|---|---|
| 2021 | 4.4% | +5 | |
| 2019 | 4.3% | +5 | |
| 2015 | -8.3% | -9 | |
| 2011 | 36.1% | +44 | |
| 2008 | 23.3% | +27 | |
| 2006 | 10.7% | +12 | |
| 2004 | 8.8% | +8 | |
Liberals
| Year | Seats | ||
|---|---|---|---|
| 2021 | 45.5% | +50 | |
| 2019 | 40.2% | +45 | |
| 2015 | 37.3% | +50 | |
| 2011 | -41.4% | -24 | |
| 2008 | -4.9% | -4 | |
| 2006 | 10.8% | +10 | |
| 2004 | 19.5% | +22 | |
| 2000 | 39.8% | +49 | |
NDP
| Year | Seats | ||
|---|---|---|---|
| 2021 | -58.3% | -35 | |
| 2019 | -55.6% | -30 | |
| 2015 | -34.3% | -23 | |
| 2011 | 9.6% | +9 | |
| 2008 | -33.9% | -19 | |
| 2006 | -46.3% | -25 | |
| 2004 | -60.4% | -29 | |
| 2000 | -50% | -13 | |
Bloc QC
| Year | Seats | ||
|---|---|---|---|
| 2021 | 23.1% | +6 | |
| 2019 | 23.1% | +6 | |
| 2011 | -77.8% | -14 | |
| 2008 | 58.1% | +18 | |
| 2006 | 59.4% | +19 | |
| 2004 | 42.1% | +16 | |
| 2000 | 18.8% | +6 | |
Green
| Year | Seats | ||
|---|---|---|---|
| 2015 | -86.4% | -19 | |
| 2008 | -100% | -21 | |
Canadian Alliance
| Year | Seats | ||
|---|---|---|---|
| 2000 | -14.3% | -11 | |
Progressive Conservatives
| Year | Seats | ||
|---|---|---|---|
| 2000 | -67.6% | -25 | |